Today at work I was doing some analysis of spending on electronic resources. I’d done it a few months ago on fiscal year 2015, in a hacky kind of way, but now that F2016 is complete I had two years ago data to work with. As usual I used Org and R, but this time I rejigged everything to use Hadley Wickham’s idea of tidy data and his tools for working with such data, and it made things not only simpler to work with in R but also to present with in Org.
Here’s a simplified example of what it looked like.lo First, I load in the R packages I’ll need for this brief example. In Org hitting Ctrl-c Ctrl-c runs these code blocks. This one is configured to have no output.
#+BEGIN_SRC R :session :results silent :exports none
library(dplyr)
library(tidyr)
library(ggplot2)
#+END_SRC
Next, a table of data: costs of things that librarians spend money on. (We can’t share our eresource spending data … perhaps some day.) This table is meant for people to read and it will appear in the exported PDF. The way it’s presented is good for humans, but not right for machines. I call it tab_costs because it’s a table of costs and I’m going to need to refer to the table later.
#+NAME: tab_costs
| name      | F2015 | F2016 |
|-----------+-------+-------|
| books     |   200 |   300 |
| cardigans |    90 |    60 |
| cats      |   400 |   410 |
| champagne |    80 |    90 |
| internet  |   130 |   140 |
| notebooks |    50 |    60 |
| tea       |    30 |    35 |
The way I have Emacs configured, that looks like this (with extra-prettified source blocks):
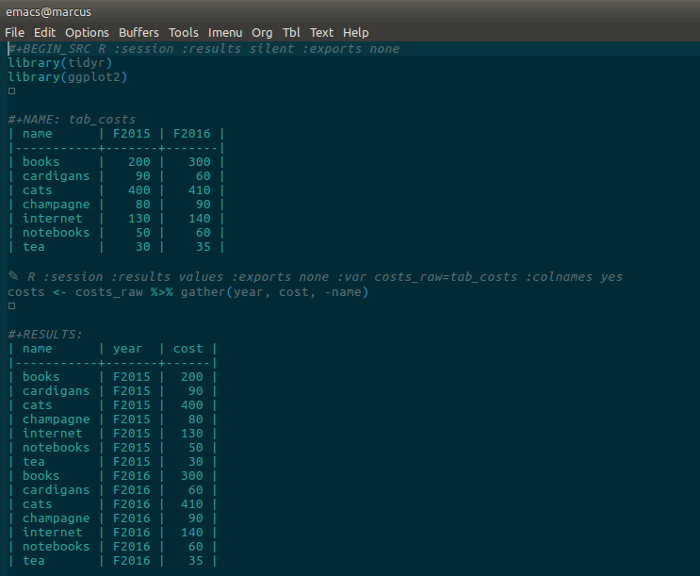
The next bit of R reads that table into the variable costs_raw, which I then transform with tidyr’s gather function into something more machine-useable. The gather statement says take all the columns except “name” and turn the column names into “year” and the cell values into “cost”. So I can see it and make sure it’ll work, the output is given, but :exports none means that this table won’t be exported when the document is turned into a PDF. Only I can see this, in Emacs.
#+BEGIN_SRC R :session :results values :exports none :var costs_raw=tab_costs :colnames yes
costs <- costs_raw %>% gather(year, cost, -name)
#+END_SRC

#+RESULTS:
| name      | year  | cost |
|-----------+-------+------|
| books     | F2015 |  200 |
| cardigans | F2015 |   90 |
| cats      | F2015 |  400 |
| champagne | F2015 |   80 |
| internet  | F2015 |  130 |
| notebooks | F2015 |   50 |
| tea       | F2015 |   30 |
| books     | F2016 |  300 |
| cardigans | F2016 |   60 |
| cats      | F2016 |  410 |
| champagne | F2016 |   90 |
| internet  | F2016 |  140 |
| notebooks | F2016 |   60 |
| tea       | F2016 |   35 |
That’s hard for humans to read, but it means making a chart comparing spending across the two years is easy.
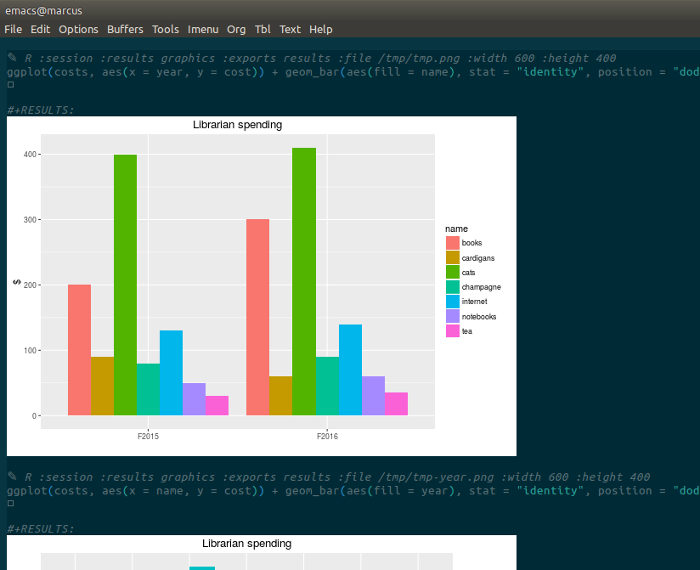
#+BEGIN_SRC R :session :results graphics :exports results :file /tmp/tmp.png :width 600 :height 400
ggplot(costs, aes(x = year, y = cost)) + geom_bar(aes(fill = name), stat = "identity", position = "dodge") + labs(x = "", y = "$", title = "Librarian spending")
#+END_SRC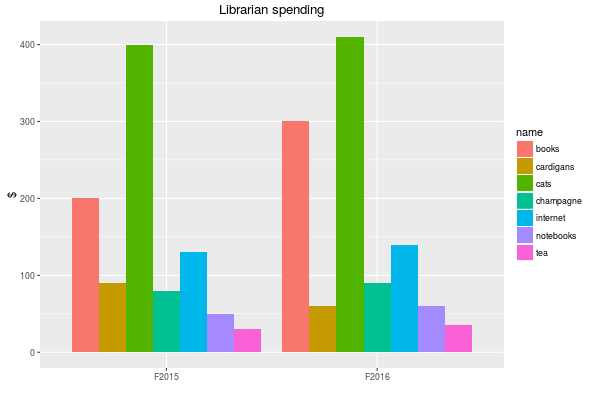
Or (see the geom_bar docs for more):
#+BEGIN_SRC R :session :results graphics :exports results :file /tmp/tmp-year.png :width 600 :height 400
ggplot(costs, aes(x = name, y = cost)) + geom_bar(aes(fill = year), stat = "identity", position = "dodge") + labs(x = "", y = "$", title = "Librarian spending")
#+END_SRC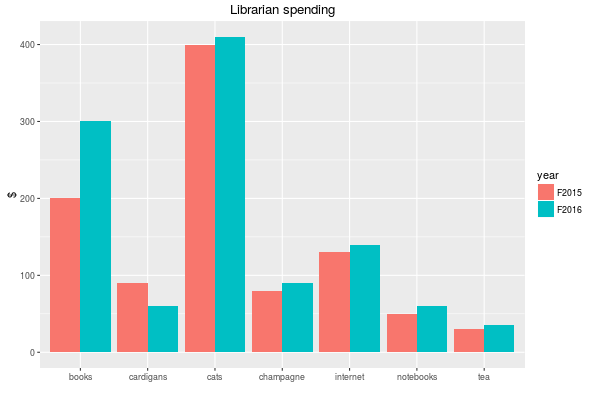
Another Emacs screenshot showing how Org mixes code, graphics and text (well, text if I’d written some, but I didn’t here):