Last year I said, regarding the Retraction Watch Database, “I wish the data was available under an open license.” Today I discovered that since September it has been openly available, thanks to Crossref acquiring it, though I’m not sure what the license is. The availability is great news! (I still hope they put an open license on it, and put the database’s web server behind HTTPS.)
I was curious to see what the data release looked like, so I downloaded the raw data dump and saved it as retraction-watch.csv. Then I opened up R in Org and moved into the tidyverse. Let’s load in the CSV, filter it for easier initial inspection, and simplify the two dates (of publication and retraction) to years and calculate their difference.
> library(tidyverse)
> r_raw <- read_csv("retraction-watch.csv", name_repair = "universal")
> library(tidyverse)
> r_raw <- read_csv("retraction-watch.csv", name_repair = "universal")
> colnames(r_raw)
[1] "Record.ID" "Title" "Subject"
[4] "Institution" "Journal" "Publisher"
[7] "Country" "Author" "URLS"
[10] "ArticleType" "RetractionDate" "RetractionDOI"
[13] "RetractionPubMedID" "OriginalPaperDate" "OriginalPaperDOI"
[16] "OriginalPaperPubMedID" "RetractionNature" "Reason"
[19] "Paywalled" "Notes"
> r <- r_raw |>
mutate(year_retraction = year(mdy_hm(RetractionDate)),
year_paper = year(mdy_hm(OriginalPaperDate)),
delay = year_retraction - year_paper) |>
select(Record.ID, Title, Author, Subject, Publisher, Country, year_retraction, year_paper, delay)
> nrow(r)
[1] 49457I checked on my entry:
> r |> filter(grepl("On Two Proposed", Title))
  # A tibble: 1 × 9
    Record.ID Title                                              Author         Subject                                  Publisher Country year_retraction year_paper delay
        <dbl> <chr>                                              <chr>          <chr>                                    <chr>     <chr>             <dbl>      <dbl> <dbl>
  1     38460 On Two Proposed Metrics of Electronic Resource Use William Denton (B/T) Computer Science;(B/T) Technology; Code4Lib  Canada             2022       2021     1
Doing some kind of histogram is always a good way to start, so here’s total number of retractions per year:
r |>
    count(year_retraction) |>
    ggplot(aes(x = year_retraction, y = n)) +
    geom_col()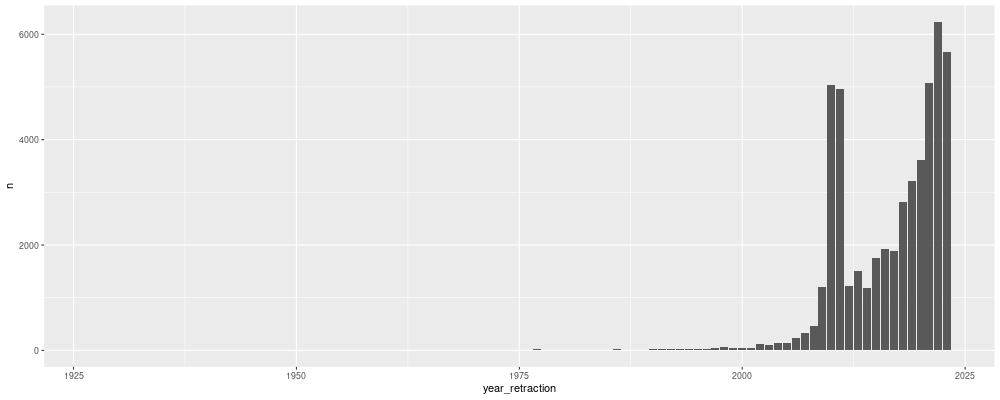
Why does it go back so far? What’s that earliest one way back when? Turns out it’s from 1927, and Retraction Watch wrote about it: Dipping into history: An 87-year-old retraction in a statistics journal.
Totals by year of publication looks quite similar, because so much is recent, so I’ll skip that. Instead let’s look at delay between publication and retraction.
But first, I noticed that one article had a negative delay: it was apparently retracted before it was published. It’s MiR-494 is regulated by ERK1/2 and modulates TRAIL-induced apoptosis in non–small-cell lung cancer through BIM down-regulation by Romano et al., which the database says was published in 2017 and retracted in 2014. The article is dated 2012 with a minor correction from 2014: “Since the results of the corrected Fig. 5 do not differ from the previous version, no changes in the text are necessary.” I’ll filter that out for now, and report it to RW later.
> r <- r |> filter(delay >= 0)Now we can plot delays. First let’s look just recent publications, for example since 2010. Reversing the x-axis makes it more readable, I think. As we go to the right we go further back into the past, so there are more articles that can have been retracted from more years, and the range spreads out.
r |>
    filter(year_paper >= 2010) |>
    ggplot(aes(x = year_paper, y = delay)) +
    geom_jitter() +
    labs(title = "Delay from year of publication (≥ 2010) to year of retraction",
         x = "Year of publication",
         y = "Years until retraction") +
    scale_x_reverse()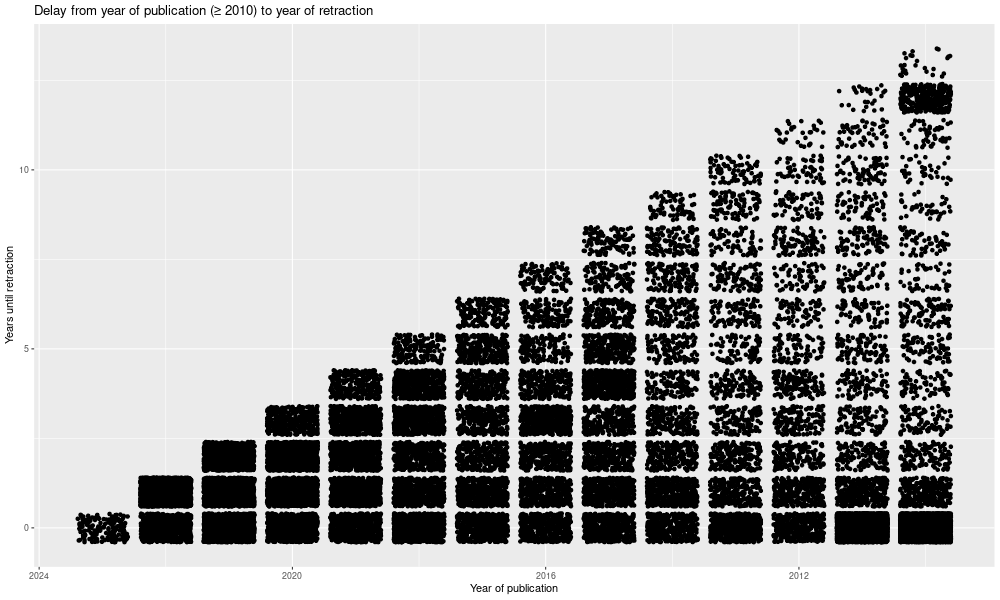
What’s that in the upper right, with a heavy chunk of papers published in 2010 and retracted 12 years later? Were they all from one publisher?
> r |> filter(year_paper == 2010, delay == 12) |> count(Publisher, sort = TRUE) |> head(5)
# A tibble: 5 × 2
  Publisher                                    n
  <chr>                                    <int>
1 Oxford Academic                            275
2 PLoS                                        14
3 Elsevier                                     4
4 Taylor and Francis - Dove Press              4
5 American Association for Cancer Research     1
Hmm, let’s go one more step.
> r |> filter(year_paper == 2010, delay == 12, Publisher == "Oxford Academic") |>
    count(Journal, sort = TRUE)
# A tibble: 2 × 2
  Journal                            n
  <chr>                          <int>
1 Journal of Crohn's and Colitis   274
2 Carcinogenesis                     1
Some of that is explained in Court injunction forces gastro journal to slap expressions of concern on 40 articles about probiotics from RW, which leads one to this mass correction:
As ordered by the Commercial Court of Vienna with respect to a temporary injunction of Dec. 12, 2019: this article contains studies and/or references to a probiotic known as VSL#3. The formulation of the currently available VSL #3 is not the same as the VSL#3 that has been scientifically assessed in studies that are subject of this article or are referenced to in this article.
Forty is not 274, but it’s all the same journal so I assume it’s all part of the same problem, and I’ll leave it there.
Finally, let’s chart all the publications and retraction delays, with no date limits.
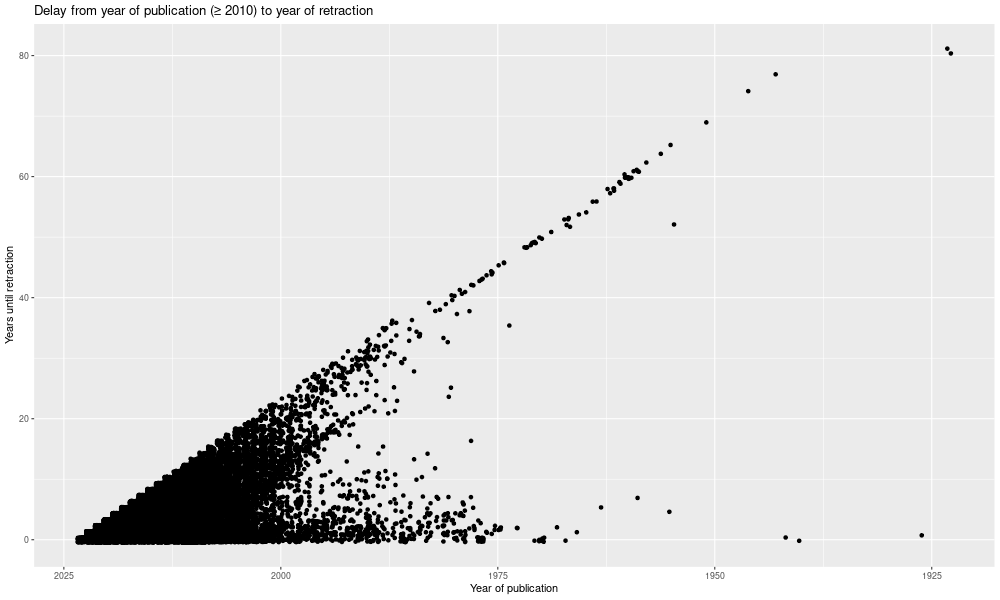
What are those ones in the upper right, written a long time ago and retracted much later? RW explains the longest delay in We have a new record: 80 years from publication to retraction. The second-longest is from the same Dutch medical journal. After that come two Journal of the Royal Society of Medicine articles by the disgraced Hans Eysenck: “Suggestibility and Hypnosis—an Experimental Analysis” (1943) and “The Measurement of Personality (Résumé)” (1946). They both have the same expression of concern.
I’m intrigued by that line that’s at about 45°. What’s it showing? Was there a year where a lot of old articles, from a range of years, were all retracted? That’s a question for another day.
(Looking back at it, I shouldn’t have used year_paper for year of publication, and perhaps not delay, but a quick look always need cleaning later.)
UPDATE (9 December 2023): Forgot the colnames call.